Recently, I ran into a problem with my research data. I was working with a table of bacterial colony isolates that were whole genome sequenced a few times because of a variety of quality issues. Consequently, I needed to deduplicate some of the records, but the mix of dates, batch numbers, and quality metrics were all different and relative to the unique sample and its first problematic sequence. As I stared at my duplicated data table almost panicking about the distinct conditions, asking myself how I would get rid of the ones I didn’t want and praying I would not have to write a loop, I remembered that I had solved this problem before! It was not for this scientific project, though. Instead, it was really just for fun.
Looking at my code from days of yore
Last fall, I participated in a holiday R data visualization competition. I enjoy these ad hoc challenges because they give me the opportunity to work with datasets I don’t normally encounter for my research. Plus, it gives me a chance to synthesize these skills with other passions, and maybe learn some new tricks I can carry into my work.
You know who loves data? Runners. Self-identifying as one, we love all kinds of time and distance stats. We love counting how many people run with us. We love seeing how we stack up against ourselves race after race and year after year. And guess what? Race results often get posted publicly, so they can be an opportunity to mess around with data exploration.
After digging around on some sites, I finally found an archive of results from the Marine Corp Turkey Trot Turkey Trot in Arlinton, VA. The results of this little endeavor were this graphic:
I’m pretty proud of the way this turned out, having never worked with gganimate() before, and I learned a few new tricks for how to scrape data from a json file, which I have to thank my brother-in-law for helping me identify those files in the web inspection element of the page. Thanks Brian! For those interested, I’ve saved the whole R script here, for you to take a look at.
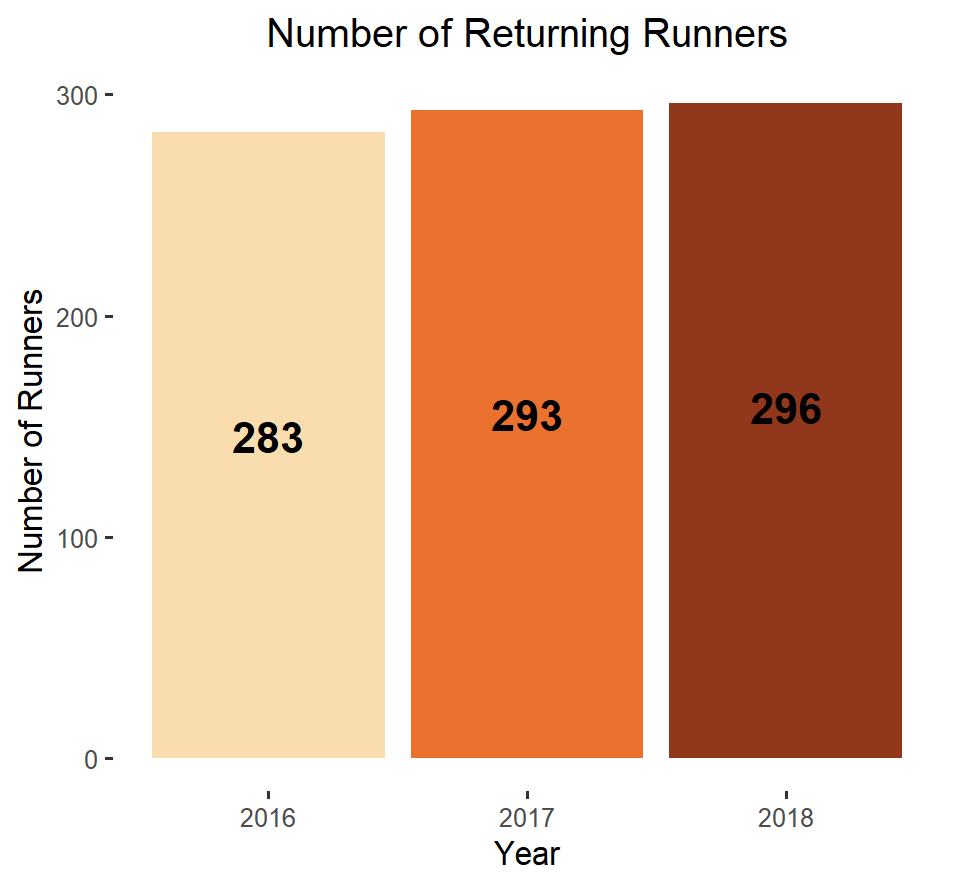
I’d like to zoom in on the third panel, though, which was an unique challenge that required me to work with duplicated records to create a new variable to find all of my returning runners separate from runners who were doing this race for their first time
Working with duplicated and dated data
Among runners each year at a long-standing race, you can bet there are some runners who have raced before. After all, holidays are all about the traditions we build! I wanted to graph the count of all of those runners who returned to this race series during the years I had collected. That meant I needed to find a way to sort the returners from the first time runners (at least in the data!).
The first information to find is duplicate participants. Since I had enough identifying info by first name, last name, and age group I could start to easily pick out the records that were likely the same person. For those sharing a name, seeing whether the age drastically changed, or if the entry shared a year of participation, was an easy way to filter out duplicate names from duplicate people.
## Filter out all the registered names, non-runners

all_TT_runners <- all_TT %>% filter(!is.na(newpace)) %>% mutate(fullname = str_to_upper(paste(firstname,lastname, sep = " ")))

## Find runners with the same name
duplicated <- all_TT_runners[all_TT_runners$fullname %in% all_TT_runners$fullname[duplicated(all_TT_runners$fullname)],]
This works up to a point, since some repeated names are just folks sharing a name, which I could tell by comparing age and location information. After manually accounting for those records,
the next challenge was to identify the first year that each participant ever ran the race. Individualized datapoints need flexible solutions; I needed to come up with a way to identify the first instance for each person so that I could filter their first race from the total year count. That’s when I learned a nifty trick using a counter and the function shift() from the package data.table
## Identify the first race for each unique person

library(data.table)
duplicated <- duplicated[order(duplicated$person_ID, duplicated$year),]

## 0 or NA indicated that this row was the firt race for this person, so they don't have a record of this being a returning race
duplicated <- duplicated %>% mutate(count = 0)
duplicated$count <- ifelse(duplicated$person_ID == shift(duplicated$person_ID), 1, 0)
Here’s what’s happening. The order() fucntion helped me sort my dataset by the person ID and then by the year. Next, I created a new variable, count, that is set to a base of 0 for all records. Here’s where the fun happens: I can update that variable so it can tell me which instance number that record is relative to the first time the name of a racer came up! What’s happening in the ifelse() statement is this: As I move from row to row in the data, I’m comparing the person ID to the Person ID in the row above it, accessed using shift() (by default, shift looks backwards). If they are the same, that means the row I am examining is one more instance of the runner returning to run the Turkey Trot. If they are not equal, then the value is 0 because the two rows are different people and the record is the debut race. It’s a nice trick but it has one issue. When you are shifting, the first or last record inherently has nothing to be compared to. R code this as a NA value.
This data was now ready for that third panel, by finding all of the instances where the count was greater than zero, indicating that the race record was an instance where a runner returned:
returners <- ggplot(duplicated %>% filter(count > 0 & (!is.na(count))), aes(x=year, fill = year)) + geom_bar() +
  labs(title = "Number of Returning Runners", x = "Year", y = "Number of Runners") +
  scale_fill_manual( values = c("#FADDAF", "#EB712F", "#91371B")) +
  geom_text(stat='count', aes(label=..count..), vjust= 10, size = 5, fontface = "bold") +
 theme(panel.background = element_blank(), legend.position = "none",
       plot.title = element_text(hjust = 0.5)) +
transition_states(year,  transition_length = 2, state_length = 1) +
  shadow_mark() +
  enter_grow()
Scientific use cases
Snap back to today, springtime (actually just a little after “Marathon Monday” for those who celebrate). I broke out this old Turkey Trot code and changed around a few variables to suit my needs and my conditions. What’s nice about this code is it’s pretty generic, and the conditional functions can be built for any kind of logic you are interested in using for rowwise comparisons. In almost no time I had the sample IDs I wanted based on the relative conditions I was using for exclusion, and I was able to move on with my life without mannually filtering each sequence out by name. This grouping and filtering approach would be useful for any longitudinal datasets. I think it’s very helpful for finding your subsets when the condition you want to sort on is relative to and individual. Some other scenarios I could see this helping to solve include:
- Tracking which is the most abundant organism across a time set of metagenomes from the same source
- Figuring out whether something is an old or new infection based on previous test results (eg serological values)
- Excluding records that don’t fall within a specific time interval from the last record.
- identifying variant fluctuations in a set of sequential genomes
There, 5 unique use cases for biology. You’re welcome!
TL; DNR
I worked on an R coding competiton where I broke down a set of road race results spanning several year and that had duplicate runners who ran multiple years. There’s a function in the data.tables R package, shift() which compares sequential records of an ordered dataset without having to use any loops. Although I used this for a fun project, it also has some useful applications for working with common problems that may emerge with infectious disease datasets. For examples of how I used this function to solve different duplicate record problems, you can check out the code in this repository